The Horwitz equation predicts the between-laboratory relative standard deviation that a chemical method will typically show at a given concentration: PRSDᴿ (%) = 2 × C−0.1505, where C is the concentration as a dimensionless mass fraction. The HorRat compares a real result with that prediction: HorRat = observed RSDᴿ / PRSDᴿ. At 1 mg/kg (C = 10⁻⁶) the predicted RSD is 16%, so an observed reproducibility RSD of 12% gives a HorRat of 0.75.
A HorRat near 1 means a method’s precision is typical for its concentration level. The sections below cover the equation, the unit conversion that trips up most users, worked examples at three concentration levels, the Thompson modification, and the limits of the approach.
The Horwitz Equation
William Horwitz and co-workers at the US Food and Drug Administration compiled the results of thousands of interlaboratory (collaborative) studies. Plotting reproducibility RSD against concentration produced a smooth curve that was largely independent of the analyte, the matrix and the method. That curve, summarized by Horwitz and Albert (2006), is the Horwitz function.
It is written in three equivalent forms:
The first form is the original expression. The second follows from it, because 0.5 × log₁₀ 2 = 0.1505. The third gives the predicted standard deviation itself, as a mass fraction, rather than a percentage. AOAC’s Appendix F uses the rounded exponent −0.15 in places; the difference is about 1% relative at 1 µg/kg, so use −0.1505 in calculators.
The symbol PRSDᴿ stands for predicted relative standard deviation under reproducibility conditions. It is a prediction for between-laboratory precision, not for replicate measurements made in one laboratory. The difference between those conditions is explained in Repeatability vs Reproducibility RSD.
Step One: Express Concentration as a Mass Fraction
C must be a pure number, with the numerator and denominator in the same units. This is the step where most Horwitz calculations go wrong.
| Concentration | Mass fraction C | Predicted RSDᴿ |
|---|---|---|
| 100% (pure substance) | 1 | 2.0% |
| 10% | 0.1 | 2.8% |
| 1% | 0.01 | 4.0% |
| 1 g/kg (0.1%) | 0.001 | 5.7% |
| 100 mg/kg | 0.0001 | 8.0% |
| 10 mg/kg | 0.00001 | 11.3% |
| 1 mg/kg (1 ppm) | 0.000001 | 16.0% |
| 100 µg/kg | 0.0000001 | 22.6% |
| 10 µg/kg | 0.00000001 | 32.0% |
| 1 µg/kg (1 ppb) | 0.000000001 | 45.3% |
The pattern is regular: the predicted RSD doubles for every 100-fold drop in concentration. For aqueous solutions, Horwitz and Albert accept µg/mL as µg/g on the assumption that 1 mL weighs 1 g. They also advise writing units explicitly rather than “ppb” or “ppt”, which readers in different countries interpret differently.
The most common Horwitz error. Entering the number in its reporting unit instead of as a mass fraction. For 5 mg/kg, the correct input is C = 0.000005, which predicts 12.56%. Entering 5 gives 2 × 5−0.1505 = 1.57%, about eight times too small, and any HorRat calculated from it is eight times too large. A published paper by McClure and Lee (J AOAC Int, 2003) exists specifically because this error appeared in practice.
Calculating HorRat
HorRat is the ratio of what was observed to what the Horwitz function predicts. AOAC Appendix F defines two versions and specifies that both use the reproducibility prediction as the denominator:
AOAC explains that the reproducibility prediction is used even for repeatability data because it is the more predictable parameter. Some other sources divide RSDᵣ by an assumed repeatability prediction, such as 0.66 × PRSDᴿ, which gives larger HorRat(r) values. Always state which convention you used.
Acceptable ranges
| Ratio | Acceptable range (AOAC) | Centre |
|---|---|---|
| HorRat(R), reproducibility | 0.5 to 2.0 | 1.0 |
| HorRat(r), repeatability | 0.3 to 1.3 | Not specified |
The HorRat(r) limits come from taking half of the lower limit and two-thirds of the upper limit of the HorRat(R) range. Horwitz and Albert describe the 0.5 to 2.0 range as empirical and note that “transgressions are occasionally permitted in both directions.” The older AOAC collaborative study guidelines add a finer reading: values between 0.5 and 1.5 correspond to historical performance, and values above 2 are problematic and may lead to rejection of a method.
Worked Example 1: A Mid-Range Analyte at 25 mg/kg
A collaborative study measures an analyte in a food material at a mean of 25 mg/kg. The study reports RSDᴿ = 12.3% and RSDᵣ = 5.4%.
Step 1: Convert to a mass fraction. 25 mg/kg = 25 × 10⁻⁶ = 2.5 × 10⁻⁵.
Step 2: Predict the reproducibility RSD.
The predicted reproducibility standard deviation is 9.85% of 25 mg/kg, about 2.46 mg/kg.
Step 3: Calculate both ratios.
Both values sit inside the AOAC ranges. The reproducibility is somewhat worse than the Horwitz prediction but well within normal experience, and the repeatability is typical. Nothing here would prompt an investigation on precision grounds.
Worked Example 2: A Trace Contaminant at 4 µg/kg
A study of a trace contaminant reports a mean of 4 µg/kg and RSDᴿ = 31%.
The mass fraction is 4 × 10⁻⁹. The original Horwitz equation predicts 2 × (4 × 10⁻⁹)−0.1505 = 36.7%, giving HorRat(R) = 31 / 36.7 = 0.84.
At this level, however, many analysts use the Thompson modification described below, which caps the prediction at 22%. On that basis HorRat(R) = 31 / 22 = 1.41. Both values fall inside 0.5 to 2.0, but the conclusion shifts from “better than predicted” to “worse than predicted.” At trace levels, always state which predictive function you used.
This example also shows why regulatory criteria must be read in their current form. For mycotoxins, the EU’s Implementing Regulation (EU) 2023/2782 replaced the earlier Horwitz-based criteria with fixed limits, including RSDᴿ at or below 25% at all concentrations. If this contaminant were a mycotoxin measured by a newly validated method, an RSDᴿ of 31% would pass a HorRat check but miss that fixed limit.
Worked Example 3: A Major Component at 45 g/100 g
The collaborative study in Repeatability vs Reproducibility RSD measured a component present at 45.35 g/100 g and found RSDᴿ = 1.15% and RSDᵣ = 0.64%.
The mass fraction is 0.4535. The original Horwitz equation predicts 2 × 0.4535−0.1505 = 2.25%, so HorRat(R) = 1.15 / 2.25 = 0.51 and HorRat(r) = 0.64 / 2.25 = 0.28. The reproducibility sits right at the lower edge of the acceptable range, and the repeatability ratio falls just below 0.3.
Above about 14%, Thompson’s modification predicts better precision than the original function: PRSDᴿ = C−0.5 = 0.4535−0.5 = 1.49%. On that basis HorRat(R) = 0.78 and HorRat(r) = 0.43, both comfortably normal. For high-concentration analytes, the original Horwitz function tends to overpredict variability, which AOAC also notes.
The Thompson Modification
Michael Thompson (Analyst, 2000) observed that collaborative trials below about 100 µg/kg gave reproducibility that was systematically better than the Horwitz function predicted. The resulting piecewise model, quoted by Horwitz and Albert, is below. Its 22% floor was written into the earlier EU mycotoxin criteria through an amendment to Regulation (EC) No 401/2006.
| Mass fraction C | Predicted RSDᴿ | Predicted SD |
|---|---|---|
| Below 1.2 × 10⁻⁷ (below 120 µg/kg) | 22% (constant) | 0.22 × C |
| 1.2 × 10⁻⁷ to 0.138 | 2 × C−0.1505 (Horwitz) | 0.02 × C0.8495 |
| Above 0.138 (above 13.8%) | C−0.5 % | 0.01 × C0.5 |
The breakpoints are where the branches meet. The Horwitz value reaches exactly 22% at C ≈ 1.2 × 10⁻⁷, and at C = 0.138 the Horwitz branch (2.69%) and the high branch (2.69%) agree. The Codex Alimentarius procedural manual applies the 22% floor below 10⁻⁷ rather than 1.2 × 10⁻⁷, a small but real difference in convention.
Interpreting HorRat Values
| HorRat(R) | Typical reading | What to check |
|---|---|---|
| Below 0.5 | Better than expected | Unreported averaging of replicates, prior knowledge of the expected result, or unusually standardized and trained participants |
| 0.5 to 1.5 | Normal performance | Nothing specific |
| 1.5 to 2.0 | Worse than typical, still acceptable | Sample homogeneity, method details that analysts interpret differently |
| Above 2.0 | Problematic | Inhomogeneous test samples, working below the limit of quantification, a method that needs optimization or more training |
The causes in the table follow the explanations given by Horwitz and Albert and in AOAC guidance. A low HorRat is not automatically good news: in a collaborative study it can mean that laboratories averaged results or knew the expected value, which makes the study less independent than it looks.
Horwitz and Albert also describe a practical use at the bottom of the range. The lowest concentration at which a method still gives a HorRat of 2.0 or less is often taken as a working estimate of its limit of reliable quantification.
Using Horwitz to Set Expectations Before a Study
The equation is also useful before any data exist. Suppose a laboratory is developing a method for an analyte at 2 mg/kg. The mass fraction is 2 × 10⁻⁶, so the predicted reproducibility RSD is 2 × (2 × 10⁻⁶)−0.1505 = 14.4%.
Repeatability is normally tighter than reproducibility. AOAC’s Appendix F tabulates a best-case predicted repeatability of half the reproducibility value, and the former EU mycotoxin criteria used 0.66 times. At 2 mg/kg that suggests a within-laboratory repeatability somewhere around 7% to 10%. If early replicate work shows 25%, the method probably needs more development. If it shows 2%, check that the replicates were truly independent preparations rather than repeat injections of one extract.
These are planning figures, not acceptance criteria. The method’s intended use, and any regulation that applies to it, decide what precision is actually required.
Horwitz in Proficiency Testing
Proficiency testing schemes compare each laboratory’s result with an assigned value using a z-score, z = (x − xa) / σp, where σp is the standard deviation for proficiency assessment. The IUPAC harmonized protocol for proficiency testing lists the Horwitz function as one way to set σp, particularly in the food sector, where it is often treated as a fitness-for-purpose criterion:
For an assigned value of 2 mg/kg, σp = 14.4% × 2 mg/kg = 0.288 mg/kg. A laboratory reporting 2.5 mg/kg scores z = 0.5 / 0.288 = 1.73, inside the usual |z| ≤ 2 band. A result of 1.3 mg/kg scores z = −2.43, which most schemes treat as questionable. The protocol recommends Thompson’s modified form at low concentrations, where the original function would set σp unrealistically wide.
Where the Horwitz Function Does Not Apply
The relationship was built from chemical concentration measurements. AOAC Appendix F lists analytes and methods where HorRat values do not apply:
- Method-defined (empirical) analytes, such as moisture, ash, fiber and carbohydrates by difference, where the method defines the result
- Physical properties and physical methods, such as pH, viscosity and drained weight, whose results are not concentrations
- Ill-defined analytes, such as polymers and products of enzyme reactions
The Codex procedural manual also excludes methods such as PCR and ELISA, which need their own criteria. For these cases, compare precision with published method performance studies instead.
Limitations and Current Debate
The Horwitz function is an empirical summary, not a physical law, and it has limitations that affect how much weight a single HorRat should carry.
RSD estimates are themselves uncertain. An RSDᴿ from a study of 8 to 20 laboratories can easily be off by about 30% relative, according to the Royal Society of Chemistry’s Analytical Methods Committee. A HorRat of 2.2 from a small study is not strong evidence that a method is worse than one with 1.8.
Modern methods often beat the prediction. A 2025 analysis in the Journal of AOAC International by Ehling and co-authors examined 961 recent data points and found only about half inside 0.5 to 2.0, with most of the rest below 0.5. The authors concluded that HorRat has lost its relevance as a criterion for judging the success of a multi-laboratory trial. Other analysts still use it as a quick benchmark, so treat it as one input rather than a pass or fail test.
Regulations move on. As noted above, the EU no longer uses Horwitz-based criteria for newly validated mycotoxin methods, while Codex guidance still uses HorRat ≤ 2 for many provisions. Always check the rule set that applies to your work.
Calculating Horwitz and HorRat in a Spreadsheet
With the mass fraction C in cell A2 and the observed RSDᴿ (as a percentage number, such as 12.3) in B2:
- Predicted RSD, original Horwitz:
=2*A2^(-0.1505) - HorRat(R):
=B2/(2*A2^(-0.1505)) - Predicted RSD with the Thompson modification:
=IF(A2<1.2E-7,22,IF(A2>0.138,A2^(-0.5),2*A2^(-0.1505)))
To convert a result in mg/kg in cell D2 to a mass fraction, use =D2*1E-6. For µg/kg, use =D2*1E-9. The observed RSD values themselves come from the collaborative study, or for a quick look at a single laboratory’s data set, from the RSD Calculator.
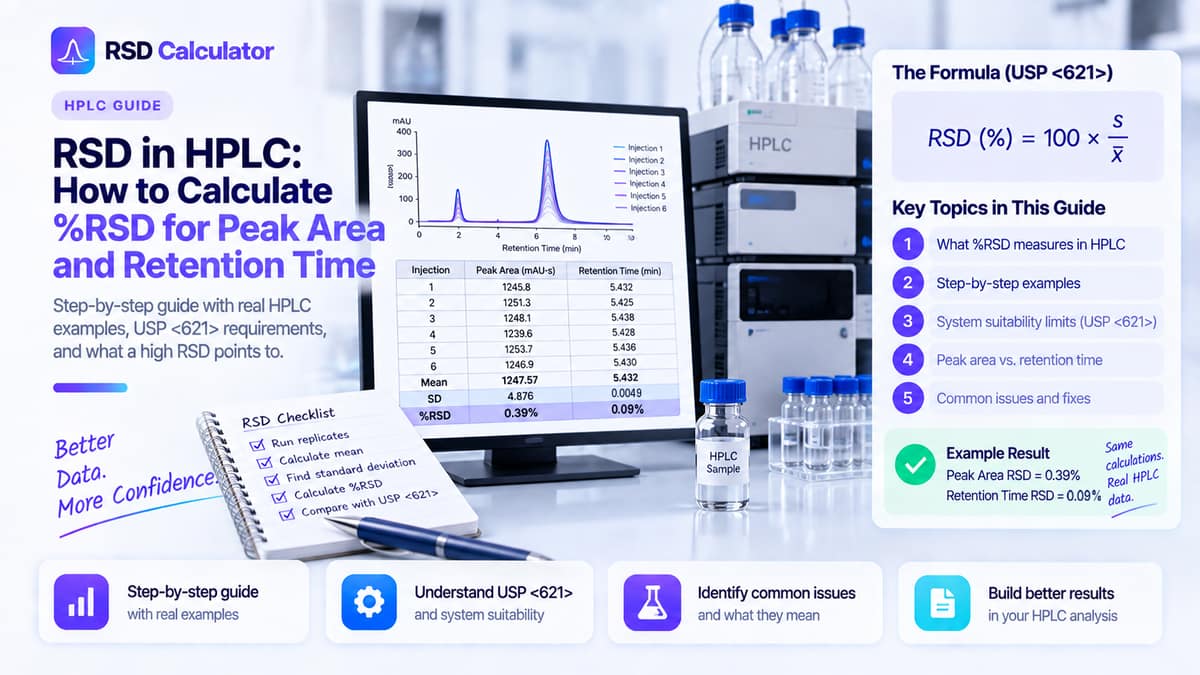
For methods that report several precision estimates, such as repeated runs at one level, combine them before comparing with Horwitz. The pooled RSD guide explains how. For chromatographic methods in particular, RSD in HPLC covers the injection-level precision that sits underneath these method-level figures.
Frequently Asked Questions
What is a good HorRat value?
For reproducibility data from a collaborative study, AOAC guidance treats HorRat(R) values from 0.5 to 2.0 as acceptable, with 1.0 meaning the precision matches the Horwitz prediction. For repeatability data, AOAC gives an acceptable HorRat(r) range of 0.3 to 1.3. These are guidelines rather than absolute limits.
What units does the Horwitz equation use?
Concentration must be a dimensionless mass fraction, with numerator and denominator in the same units. 100% is 1, 1% is 0.01, 1 mg/kg (1 ppm) is 0.000001 and 1 µg/kg (1 ppb) is 0.000000001. Entering 5 for 5 mg/kg instead of 0.000005 understates the predicted RSD about eightfold.
Can HorRat be used for single-laboratory validation?
It can be used as a rough guide. AOAC describes HorRat(r) for repeatability data, dividing the observed repeatability RSD by the predicted reproducibility RSD. Horwitz and Albert note that applying it to within-laboratory data is less reliable than its original use with between-laboratory data.
Does the EU still use the Horwitz equation for mycotoxin methods?
Not for new methods. Commission Implementing Regulation (EU) 2023/2782, which applies from 1 April 2024, sets fixed precision criteria instead: RSDr and within-laboratory reproducibility at or below 20% and RSDR at or below 25%. The older Horwitz-based criteria remain only for methods validated before that date, until 1 January 2029.
Why does the predicted RSD increase at low concentrations?
The Horwitz relationship is empirical: across thousands of collaborative studies, relative precision was found to worsen in a regular way as concentration fell, roughly doubling for every 100-fold decrease. No accepted theory fully explains the exact exponent.