These 30 original relative standard deviation practice problems run from simple %RSD calculations to reverse-formula and laboratory interpretation questions. Each level starts easier than it ends, and every answer is in the answer key, with full step-by-step solutions for the problems that trip people up most. Because %RSD is the coefficient of variation multiplied by 100, the set also works as coefficient of variation practice.
Use one formula throughout, where s is the standard deviation and x̄ is the mean:
How to Work These Problems
Follow the same routine for every raw-data question. It makes errors easy to find when your answer does not match the key.
- Add the values and divide by n to get the mean.
- Subtract the mean from each value and square each deviation.
- Add the squared deviations. Divide by n − 1 for a sample SD or n for a population SD, then take the square root.
- Divide the SD by the mean and multiply by 100.
Keep at least four or five significant figures until the last step. Round only the final RSD, to two decimal places unless a problem says otherwise. Problems use the sample SD unless they say population or ask you to choose. The n − 1 and n divisors follow the standard definitions in OpenStax Introductory Statistics, section 2.7, and the RSD definition matches NIST’s coefficient of variation reference. If you need a refresher on the concept first, read What Is Relative Standard Deviation?.
Level 1: RSD From the Mean and Standard Deviation
These problems give you the summary statistics directly. They test the formula and the percent conversion only.
- A set of replicate weighings has a mean of 40.0 g and a standard deviation of 1.2 g. Calculate the %RSD.
- A spectrophotometer gives a mean absorbance of 0.850 with a standard deviation of 0.017. Calculate the %RSD.
- A production line fills bags with a mean mass of 1,250 g and a standard deviation of 31.25 g. Calculate the %RSD.
- A batch of coated seeds has a mean mass of 7.35 g per 100 seeds with a standard deviation of 0.22 g. Calculate the %RSD to two decimal places.
- Method A has a mean of 12 mg/L and an SD of 0.6 mg/L. Method B has a mean of 480 mg/L and an SD of 9.6 mg/L. Which method has the better relative precision?
- A report lists a coefficient of variation of 0.045. Express it as %RSD.
Level 2: RSD From Raw Data
Now calculate the mean and the sample standard deviation yourself before applying the RSD formula.
- Calculate the %RSD of 10, 12, 11, 13, 14.
- Four replicate titrations reach the end point at 5.2, 5.4, 5.1 and 5.3 mL. Calculate the %RSD.
- Calculate the %RSD of six check-weight readings: 98, 102, 100, 101, 99, 100 mg.
- Five pipette deliveries are weighed as 0.251, 0.248, 0.255, 0.249 and 0.252 g. Calculate the %RSD.
- Seven moisture results for the same sample are 18.4, 19.1, 18.8, 18.2, 19.0, 18.7 and 18.6%. Calculate the %RSD of these results.
- Five replicate results are 50.1, 49.8, 50.3, 50.0 and 57.9. Calculate the %RSD. Then calculate it again without 57.9 and explain what the comparison shows.
Level 3: Sample or Population Standard Deviation?
These problems test whether you choose the correct divisor. The distinction is explained in full in the sample vs population standard deviation guide.
- Recalculate problem 7 using the population standard deviation. By how many percentage points does the RSD change?
- A teacher records the test scores of all 24 students in one class and wants to describe the spread of that class only. Which standard deviation should be used for the RSD?
- A calculator shows sx = 0.35 and σx = 0.32 for the masses of 5 tablets taken from a batch of 50,000. Which value belongs in the RSD, and why?
- For the values 3.0, 3.4 and 3.2, calculate the RSD with both the sample and the population SD. Why is the gap so large?
- A calculator displays σx = 0.84 and x̄ = 21.0 for n = 8 replicate measurements. Convert to the sample SD and report the sample-based %RSD.
Level 4: Reverse RSD Formula Problems
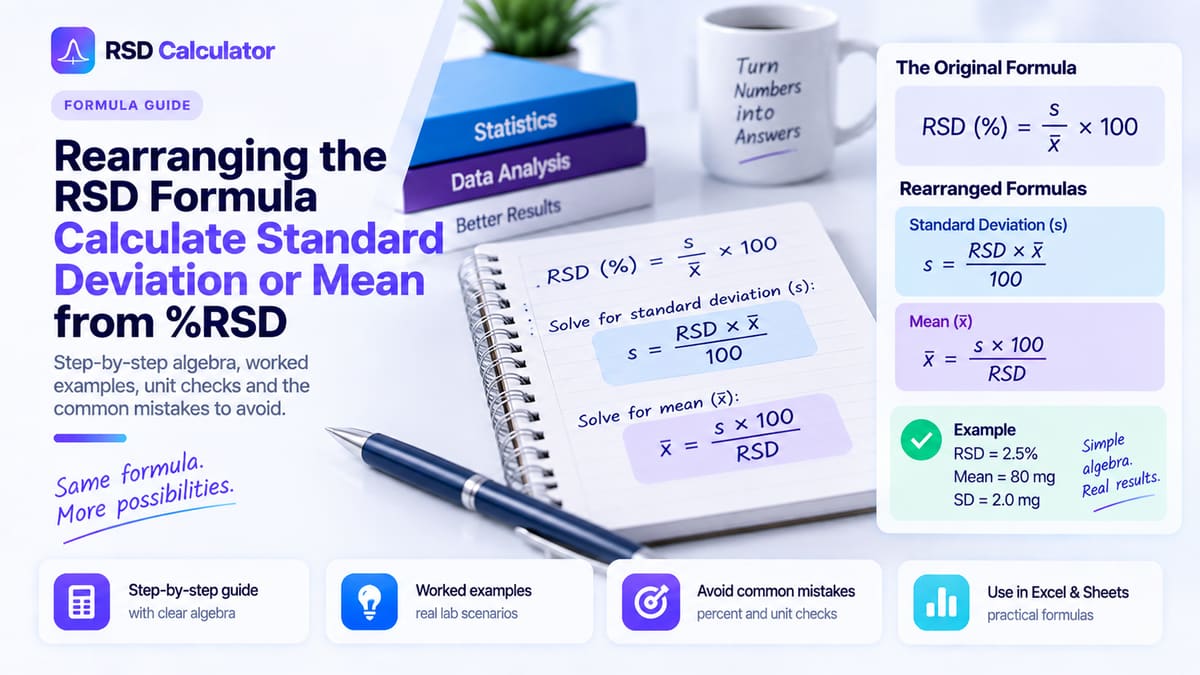
Here you work backwards from %RSD. The rearranged formulas are SD = (RSD × mean) / 100 and mean = (SD × 100) / RSD, explained in Rearranging the RSD Formula.
- A method has a precision of 2.4% RSD at a mean of 150 µg/mL. What is the standard deviation?
- A set of results has a standard deviation of 0.52 and an RSD of 0.8%. What is the mean?
- A data sheet gives a CV of 0.032 at a mean of 8.75 g. What is the standard deviation?
- A mean mass is 1.6 g and the standard deviation is 12 mg. Calculate the %RSD.
- An instrument has a nearly constant standard deviation of 0.15 µg/L at low concentrations. What is the lowest mean concentration that still gives an RSD of 5% or less?
- A data set has a sample variance of 0.0144 and a mean of 2.4. Calculate the %RSD.
Level 5: Laboratory Interpretation
These questions need judgement as well as arithmetic. There is not always a single number to find.
- Two analysts each run six replicates of the same sample. Analyst A reports 0.9% RSD and Analyst B reports 2.7% RSD. The laboratory’s internal limit for this test is 2.0% RSD. What should happen next?
- Five blank samples give 0.02, −0.01, 0.03, 0.00 and −0.02 mg/L. Calculate the RSD and explain whether it is a useful measure of precision here.
- Method X gives an SD of 0.08 mg/L at a mean of 2 mg/L. Method Y gives an SD of 2.0 mg/L at a mean of 200 mg/L. A colleague says Method Y is four times more precise. Is that conclusion justified?
- A certified reference material has a value of 10.00 mg/kg. Four replicate results are 9.52, 9.55, 9.50 and 9.53 mg/kg. Calculate the RSD and the percent bias. What do the two numbers tell you together?
- Only two results are available: 50.0 and 52.0. Calculate the sample %RSD and comment on how reliable the estimate is.
Bonus Problems: Parts per Thousand and Consistency
- Some chemistry courses report relative standard deviation in parts per thousand (‰) instead of percent. Express the RSD from problem 9 in parts per thousand.
- Three lots are tested. Lot X has a mean of 48.0 and an SD of 1.2. Lot Y has a mean of 120 and an SD of 2.4. Lot Z has a mean of 15 and an SD of 0.45. Rank the lots from most to least consistent relative to their means.
Answer Key
RSD values use the sample standard deviation unless the problem says otherwise.
| # | Answer |
|---|---|
| 1 | 3.00% |
| 2 | 2.00% |
| 3 | 2.50% |
| 4 | 2.99% |
| 5 | Method B (2.00% vs 5.00%) |
| 6 | 4.50% |
| 7 | Mean 12, s = 1.5811, RSD = 13.18% |
| 8 | Mean 5.25, s = 0.12910, RSD = 2.46% |
| 9 | Mean 100, s = 1.4142, RSD = 1.41% |
| 10 | Mean 0.251, s = 0.0027386, RSD = 1.09% |
| 11 | Mean 18.686, s = 0.31848, RSD = 1.70% |
| 12 | 6.81% with 57.9; 0.42% without |
| 13 | 11.79%, a drop of 1.39 percentage points |
| 14 | Population SD |
| 15 | sx = 0.35 (sample SD) |
| 16 | 6.25% (sample) vs 5.10% (population) |
| 17 | s = 0.89800, RSD = 4.28% |
| 18 | 3.6 µg/mL |
| 19 | 65 |
| 20 | 0.28 g |
| 21 | 0.75% |
| 22 | 3.0 µg/L |
| 23 | s = 0.12, RSD = 5.00% |
| 24 | Investigate Analyst B’s results (see solution) |
| 25 | About 518%; not meaningful |
| 26 | Not justified on RSD alone |
| 27 | RSD = 0.22%, bias = −4.75% |
| 28 | 2.77%, from only one degree of freedom |
| 29 | 14.1‰ (1.4142% × 10) |
| 30 | Y (2.0%), then X (2.5%), then Z (3.0%) |
Step-by-Step Solutions
Problem 7
The sum is 10 + 12 + 11 + 13 + 14 = 60, so the mean is 60 / 5 = 12.
| Value | Deviation | Squared deviation |
|---|---|---|
| 10 | −2 | 4 |
| 12 | 0 | 0 |
| 11 | −1 | 1 |
| 13 | 1 | 1 |
| 14 | 2 | 4 |
| Total | 0 | 10 |
Sample variance = 10 / (5 − 1) = 2.5, so s = √2.5 = 1.5811. RSD = 1.5811 / 12 × 100 = 13.18%. The deviations add to zero, which is a quick check that the mean is right.
Problem 10
Small decimals are easy to mistype, so convert to milligrams first: 251, 248, 255, 249 and 252 mg. The mean is 1,255 / 5 = 251 mg. The deviations are 0, −3, 4, −2 and 1, and their squares add to 0 + 9 + 16 + 4 + 1 = 30.
Sample variance = 30 / 4 = 7.5, so s = √7.5 = 2.7386 mg. RSD = 2.7386 / 251 × 100 = 1.09%. Working in grams gives exactly the same RSD, because both the SD and the mean scale by the same factor of 1,000. That is the practical meaning of RSD being unit-free.
Problem 11
The sum is 130.8, so the mean is 130.8 / 7 = 18.6857. The squared deviations add up to 0.60857. Dividing by n − 1 = 6 gives a variance of 0.101429, and s = 0.31848. RSD = 0.31848 / 18.6857 × 100 = 1.70%.
The data are percentages, but the RSD is still a percentage of the mean. Here the result means the spread is 1.70% of 18.69%, not 1.70 percentage points of moisture.
Problem 12
With all five values, the mean is 51.62, s = 3.5153 and RSD = 6.81%. Without 57.9, the mean is 50.05, s = 0.20817 and RSD = 0.42%.
A single value raised the RSD roughly sixteen-fold. That shows how sensitive the standard deviation is to one extreme result. It does not justify deleting the value. Check for a documented cause, such as a transcription or preparation error, or apply a formal outlier test that your procedure allows, and report what you did.
Problem 15
Use sx = 0.35. The five tablets are a small sample drawn to estimate the variability of a batch of 50,000, so the sample standard deviation (n − 1) is the appropriate estimate. σx = 0.32 only describes the spread of those five particular tablets and would understate the batch variability. The same reasoning answers problem 14 the other way round: the 24 scores are the entire class being described, so the population SD fits.
Problem 16
The mean is 3.2 and the squared deviations are 0.04, 0.04 and 0, which add to 0.08.
- Sample: s = √(0.08 / 2) = 0.2000, RSD = 6.25%
- Population: σ = √(0.08 / 3) = 0.16330, RSD = 5.10%
With n = 3, the divisors 2 and 3 differ by 50%, so the choice matters a lot. As n grows, n − 1 and n get closer and the two RSD values converge.
Problem 17
The two standard deviations are related by s = σ × √(n / (n − 1)). With n = 8:
RSD = 0.89800 / 21.0 × 100 = 4.28%. Using σx directly would give 4.00%, which understates the variability of the process the eight measurements represent.
Problem 21
Convert the units first: 12 mg = 0.012 g. RSD = 0.012 / 1.6 × 100 = 0.75%. Dividing 12 by 1.6 without converting gives 750%, which is the classic unit-mismatch error.
Problem 22
Rearrange for the mean with RSD = 5 and s = 0.15:
Below 3.0 µg/L the same SD is a larger share of the mean, so the RSD climbs above 5%. This assumes the SD stays constant at low levels, which should be confirmed with replicates near that concentration.
Problem 24
Analyst A is within the 2.0% limit and Analyst B is not. The next step is an investigation of Analyst B’s run, not averaging the two RSD values together. Typical checks are sample preparation, instrument performance during that run, calculation errors and whether the analyst followed the written procedure.
If both analysts measured the same homogeneous sample, the difference points to a source of variation in B’s work. The quality control and method validation guide covers how precision checks fit into a laboratory’s wider QC system.
Problem 25
The mean is 0.004 mg/L and s = 0.020736 mg/L, which gives an RSD of about 518%.
This RSD is not a useful precision figure. The blanks scatter around zero, so the mean is close to zero and even slightly negative values appear. Dividing by a mean that small inflates the ratio. For blanks, report the standard deviation itself (0.021 mg/L). Detection-limit estimates are commonly built on the blank SD, not on a ratio to the mean.
Problem 26
Method X has an RSD of 0.08 / 2 × 100 = 4.0%. Method Y has an RSD of 2.0 / 200 × 100 = 1.0%. The ratio is four, but the methods were tested at concentrations 100 times apart.
Relative precision usually gets worse as concentration falls, a pattern the Horwitz equation describes, so a 4% RSD at 2 mg/L may be perfectly good performance. The fair comparison is both methods at the same concentration, in the same matrix, under the same conditions.
Problem 27
The mean is 9.525 mg/kg and s = 0.020817 mg/kg, so RSD = 0.22%. The bias is (9.525 − 10.00) / 10.00 × 100 = −4.75%.
The results are very precise but not accurate. They agree closely with each other while sitting almost 5% below the certified value. RSD only describes precision, so a low RSD never proves a result is correct.
Problem 28
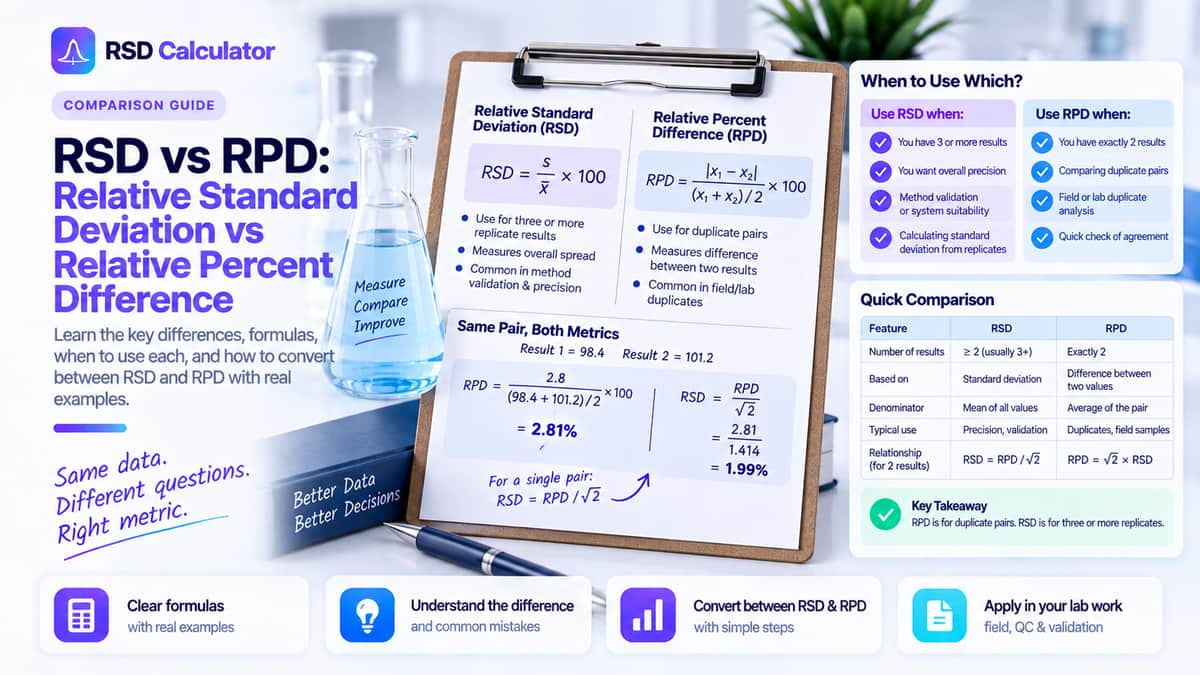
The mean is 51.0 and s = 1.4142, so RSD = 2.77%. With two values there is only one degree of freedom, so the estimate is very uncertain. A third or fourth replicate could change it substantially. For a pair of results, laboratories often report the relative percent difference instead, which is explained in RSD vs RPD.
Problem 29
Parts per thousand multiply the ratio by 1,000 instead of 100:
A quick shortcut is to multiply the percent value by 10. Always label the unit, because 14.1 without a symbol could be misread as 14.1%.
How to Check Your Own Answers
Three quick checks catch most mistakes before you compare with the key.
- Deviations sum to zero. If the deviations from your mean do not add to zero (allowing for rounding), the mean is wrong.
- The SD is smaller than the range. The standard deviation of a data set is never larger than the difference between the largest and smallest values.
- Reverse the formula. Multiply your RSD by the mean and divide by 100. You should get your SD back.
For the raw-data problems, enter the values in the RSD Calculator with the Sample (n − 1) option to confirm the mean, standard deviation and %RSD. Switch to Population (n) to check problems 13 and 16.
Frequently Asked Questions
How many decimal places should I report for %RSD?
Keep full precision in the mean and standard deviation while you work, then round only the final RSD. Two decimal places or three significant figures is usual for coursework. Laboratory reports often follow the rounding rule written in the method or specification.
Should I use sample or population standard deviation in RSD problems?
Use the sample standard deviation (n − 1) when the values are a sample used to estimate a larger process, such as replicate measurements. Use the population standard deviation (n) only when the data set is the entire group you want to describe. If a textbook problem does not say, check which convention the course uses; most analytical chemistry courses use the sample SD.
Why does my answer differ slightly from the answer key?
The most common cause is rounding the mean or the standard deviation before dividing. Recalculate with unrounded intermediate values. A difference in the second decimal place can also come from using the population SD instead of the sample SD.
Why does my textbook's answer use a different standard deviation?
Some courses, particularly school-level coefficient of variation exercises, use the population standard deviation (dividing by n) by default, while analytical chemistry courses usually use the sample standard deviation (n − 1). Both are valid for their purpose. Check which divisor your course expects before comparing answers.
Can RSD be negative?
With a positive mean, no. A negative mean gives a negative ratio, and some sources report the absolute value instead. RSD is intended for positive, ratio-scale data, so a negative or near-zero mean is a signal to report the standard deviation instead.