Pooled relative standard deviation combines the RSD values from several groups into one precision estimate by weighting each group’s squared RSD by its degrees of freedom, n − 1, and then taking the square root. It is not the simple average of the %RSD values.
For example, runs with 3 and 10 replicates and RSDs of 4.0% and 1.0% have a simple average of 2.5%, but a pooled RSD of 1.93%. This guide shows how the formula works, when pooling is valid, and how it differs from pooling standard deviations.
What Pooling Does
Every RSD estimated from a small group is uncertain. Five replicates give only four degrees of freedom, so a second run of five can easily return a noticeably different RSD even when nothing has changed.
Pooling treats several groups as repeated estimates of the same underlying precision. Combining them gives one estimate with many more degrees of freedom than any single group. The Eurachem validation guide puts it plainly: it is difficult to estimate a reliable standard deviation from few replicates, so values from several small sets “can be combined (pooled) to obtain estimates with sufficient degrees of freedom.” Laboratories use it for situations such as:
- replicate runs of the same sample on several days, when you want the within-run precision
- a method checked at several concentration levels where the RSD is roughly constant
- many duplicate pairs from routine samples, each contributing a little information
- several instruments or analysts that are expected to perform the same way
Pooling only makes sense when the groups really do share one precision. If one group is truly worse than the others, pooling hides that difference instead of revealing it.
Pooled SD or Pooled RSD?
Both are pooled the same way, through variances weighted by degrees of freedom. The difference is which quantity you assume stays constant across groups.
| Question | Pooled SD | Pooled RSD |
|---|---|---|
| What is assumed constant? | The absolute standard deviation | The standard deviation relative to the mean |
| Typical use | Several groups at the same level (same sample, same concentration) | Groups at different levels where error scales with the value |
| Result units | Same units as the data | Percent |
| Formula | √[ Σ (nᵢ − 1) sᵢ² / Σ (nᵢ − 1) ] | √[ Σ (nᵢ − 1) RSDᵢ² / Σ (nᵢ − 1) ] |
Which assumption fits depends on the concentration range. Eurachem notes that well above the detection limit, precision is often proportional to concentration, so a relative standard deviation is approximately constant. Near the detection limit, the absolute standard deviation tends to level off instead. The Nordtest handbook for environmental laboratories (TR 537) handles one data set in exactly this way, pooling absolute standard deviations below about 30 µg/L and relative ones above it.
When all the groups have almost the same mean, the two approaches agree. The pooled SD divided by the overall mean gives nearly the same percentage as pooling the RSD values directly. When the means differ a lot, pooling the SDs is usually wrong, because the high-level groups dominate the result. Worked Example 2 shows this.
The Formulas
For k groups, where group i has nᵢ values, standard deviation sᵢ and mean x̄ᵢ:
Here N is the total number of values. Each sᵢ is the sample standard deviation of its group, calculated with the n − 1 divisor. Pooling is built on that divisor, so population SDs should not be used.
These are standard formulas. The pooled variance, Σ (Nᵢ − 1) sᵢ² / (N − k), appears in the NIST/SEMATECH e-Handbook’s section on Bartlett’s test. The IUPAC Gold Book entry for pooled standard deviation gives both the pooled SD and the pooled relative standard deviation in this form, for series “of the same precision although their means may differ.” A University of Tartu method-validation course describes the result as “a weighted root mean square (RMS) average” with degrees of freedom as the weights.
Two features of the formula matter:
- Squares, not raw values. Variances combine by addition, while standard deviations do not. That is why the RSD values are squared before they are averaged and the square root is taken at the end.
- Weights of n − 1, not n. A group of five values carries four degrees of freedom. A group of two carries one, and a single value carries none, so it cannot contribute to a pooled estimate at all.
Why Averaging %RSD Values Can Be Wrong
A simple average of RSD values makes two separate mistakes.
It ignores group size. Take one run with n = 3 and RSD = 4.0%, and another with n = 10 and RSD = 1.0%. The ten-value run carries 9 degrees of freedom against 2, so it deserves far more weight.
It averages standard deviations instead of variances. Even when group sizes are equal, the two answers differ. With n = 6 in both runs and RSDs of 4.0% and 1.0%, the simple average is still 2.50%, while the pooled value is √[(5 × 16 + 5 × 1) / 10] = √8.5 = 2.92%. Averaging the RSDs themselves understates precision whenever the groups disagree.
The simple average is only exactly equal to the pooled value when every group has the same RSD, which is the one case where pooling is not needed.
The effect is not just theoretical. Nordtest TR 537 (edition 4) lists 26 duplicate pairs of an environmental analyte above 30 µg/L and reports a pooled relative standard deviation of 3.8%. Recalculating from the published pairs gives 3.82% by the pooled formula, while the simple average of the 26 individual relative standard deviations is only 2.65%. Averaging would have understated the precision figure by about 30%.
Worked Example 1: One Sample, Three Runs
A laboratory measures the same control material in three separate runs. The analyst wants a single within-run precision estimate. The results are in mg/g.
| Run | Values | n | Mean | Sample SD | RSD |
|---|---|---|---|---|---|
| 1 | 20.12, 20.35, 20.08, 20.27, 20.19 | 5 | 20.2020 | 0.10986 | 0.5438% |
| 2 | 20.41, 20.22, 20.30, 20.48 | 4 | 20.3525 | 0.11529 | 0.5665% |
| 3 | 20.05, 20.31, 20.18, 19.96, 20.24, 20.14 | 6 | 20.1467 | 0.12707 | 0.6307% |
Step 1: Degrees of freedom. The runs contribute 4, 3 and 5, a total of 12.
Step 2: Weight each squared RSD.
| Run | nᵢ − 1 | RSDᵢ² | (nᵢ − 1) × RSDᵢ² |
|---|---|---|---|
| 1 | 4 | 0.29575 | 1.18298 |
| 2 | 3 | 0.32088 | 0.96264 |
| 3 | 5 | 0.39781 | 1.98905 |
| Total | 12 | 4.13468 |
Step 3: Divide and take the square root.
Pooling the standard deviations gives the same answer here, because the three means are very close. The pooled SD is √[(0.04828 + 0.03988 + 0.08073) / 12] = 0.11863 mg/g, and 0.11863 / 20.22 × 100 = 0.587%. The simple average of the three RSDs, 0.580%, is close in this case only because the runs agree well.
Why not put all 15 values into one data set?
If you enter all 15 results as a single data set, you get a mean of 20.22 mg/g, an SD of 0.13964 mg/g and an RSD of 0.69%. That is larger than the pooled 0.59% because it also includes the shifts between run means (20.20, 20.35 and 20.15).
Neither number is wrong. They answer different questions. The pooled value describes precision within a run. The combined data set mixes in run-to-run variation, which is closer to intermediate precision. The difference between those conditions is explained in Repeatability vs Reproducibility RSD.
Worked Example 2: Three Concentration Levels
A method is checked at three levels. The standard deviation clearly grows with concentration, but the RSD stays close to 1.2% throughout.
| Level (mg/L) | n | Sample SD (mg/L) | RSD | (nᵢ − 1) × RSDᵢ² |
|---|---|---|---|---|
| 5.02 | 6 | 0.061 | 1.2151% | 7.3828 |
| 25.3 | 6 | 0.33 | 1.3043% | 8.5066 |
| 99.4 | 4 | 1.12 | 1.1268% | 3.8088 |
| Total | ν = 13 | 19.6982 |
A pooled RSD of 1.23% with 13 degrees of freedom describes all three levels well. It implies an SD of about 0.062 mg/L at 5.02 mg/L and about 1.22 mg/L at 99.4 mg/L, both close to what was observed.
Pooling the standard deviations instead gives sp = 0.577 mg/L. That figure is 11.5% of the lowest level and 0.58% of the highest, so it describes none of them. When the SD scales with the level, pool the RSD.
Special Case: Pooling Duplicate Pairs
Routine work often produces many pairs of duplicate results at different concentrations. Each pair is a group with n = 2 and one degree of freedom. Applying the general formula to k pairs simplifies to:
Here dᵢ is the difference between the two results in pair i and x̄ᵢ is the pair mean. The 2 in the denominator comes from the SD of two values, which equals |d| / √2. The IUPAC Gold Book gives the absolute version of this shortcut, sp = √[Σ (xᵢ₁ − xᵢ₂)² / (2k)], for pairs at a similar level. The relative version is equivalent to the calculation behind the pooled figures in Nordtest TR 537, Appendix 5.
Because each term dᵢ / x̄ᵢ × 100 is a relative percent difference, the same result can be written as the root mean square of the RPD values divided by √2.
| Pair | Results | Mean | d | (d / x̄)² |
|---|---|---|---|---|
| 1 | 12.4, 12.9 | 12.650 | −0.50 | 0.00156228 |
| 2 | 8.15, 8.02 | 8.085 | 0.13 | 0.00025854 |
| 3 | 25.6, 25.1 | 25.350 | 0.50 | 0.00038903 |
| 4 | 3.42, 3.51 | 3.465 | −0.09 | 0.00067465 |
| 5 | 17.8, 18.3 | 18.050 | −0.50 | 0.00076734 |
| Sum | 0.00365184 |
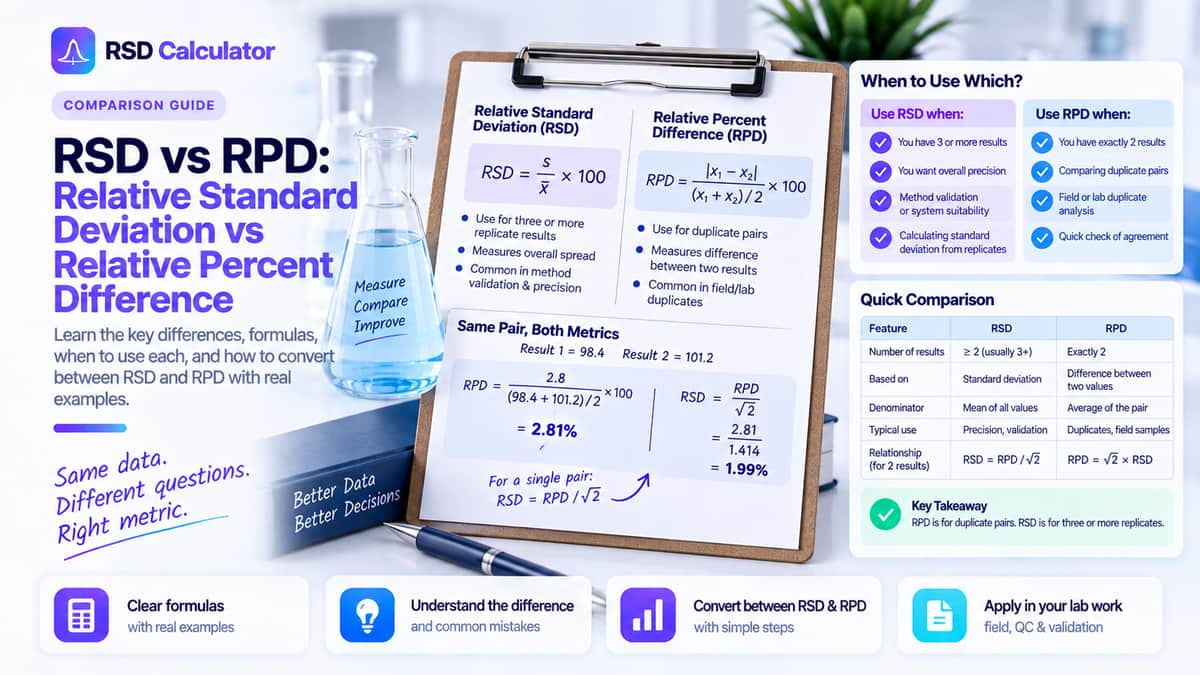
Five pairs give only five degrees of freedom. In practice, laboratories collect many more pairs before relying on the estimate. For a single pair, the relative percent difference is often reported instead, as covered in RSD vs RPD.
When You Should Not Pool
Pooling assumes the groups share one underlying precision. Check that assumption before combining anything.
- The RSD changes with the level. If a method gives 4.0% at 2 mg/L but 1.9% at 50 mg/L, one pooled figure would overstate the error at high levels and understate it at low ones. Report each level, or pool only the levels that agree.
- The groups measure different things. Different methods, matrices or measurement conditions should not be pooled into one precision claim.
- One group is an outlier. A single run with a much larger RSD may have a real cause. Investigate it before deciding to pool. Formal checks such as Bartlett’s test and Levene’s test, both described in the NIST e-Handbook, or Cochran’s test in collaborative studies, compare group variances. With small groups they have little power, so judgement about the method matters too.
- The matrices differ a lot. The Tartu course notes that samples pooled together should be reasonably similar in analyte content and matrix, even if they are not identical.
- The mean is close to zero. A group with a near-zero mean can have an enormous RSD that swamps the pooled value. Pool standard deviations for blanks and very low levels instead, if the SD is roughly constant there.
- A group has only one value. It has no degrees of freedom and contributes nothing, so leave it out rather than entering an RSD of zero.
Interpreting and Reporting a Pooled RSD
Always report the degrees of freedom alongside the result, for example “pooled RSD = 0.59% (ν = 12)”. The degrees of freedom tell the reader how much data supports the figure. A pooled estimate with 12 degrees of freedom is far more stable than any one run with 3 or 4.
State what was pooled and under which conditions. “Pooled within-run RSD from three runs of the same control material” is clear. “Pooled RSD” on its own leaves the reader guessing whether day-to-day variation is included.
Common Errors
| Error | Why it is wrong | Fix |
|---|---|---|
| Averaging the %RSD values | Ignores group size and averages SDs instead of variances | Weight RSD² by n − 1, then take the square root |
| Weighting by n instead of n − 1 | Overweights small groups slightly and breaks the link to the sample variance | Use n − 1 |
| Using population SDs for each group | Underestimates each group’s variance | Use sample SDs (n − 1 divisor) |
| Pooling SDs across very different levels | High-level groups dominate the result | Pool RSDs when error scales with the value |
| Lumping all values into one data set | Adds between-group differences | Pool within-group variation, or report both deliberately |
| Forgetting to take the square root | Reports a pooled variance as if it were an RSD | Finish with √ |
Pooled RSD in a Spreadsheet
With group sizes in B2:B4 and RSD values (as plain numbers such as 0.54) in C2:C4, one formula gives the pooled RSD in Excel or Google Sheets:
=SQRT(SUMPRODUCT((B2:B4-1)*C2:C4^2)/(SUM(B2:B4)-COUNT(B2:B4)))
The denominator, SUM(B2:B4) − COUNT(B2:B4), is the total degrees of freedom. For the individual group RSDs, the RSD Calculator gives the sample SD and %RSD of each run, which you can then pool with the formula above.
Frequently Asked Questions
Is pooled RSD the same as the average RSD?
No. Pooled RSD is the square root of the degrees-of-freedom weighted average of the squared RSD values. A simple average ignores group sizes and averages standard deviations instead of variances, so it usually differs from the pooled value and has no clear statistical meaning.
Can I pool RSD values from groups with different means?
Yes, if the relative standard deviation is roughly constant across those means, which is common when measurement error grows in proportion to the measured value. If the RSD clearly changes with the level, report each level separately or pool only the levels that agree.
What is the difference between pooled RSD and the RSD of all data combined?
Pooled RSD combines the variation within each group only. Putting every value into one data set also includes the differences between group means, such as day-to-day shifts, so it measures a broader kind of precision and is usually larger.
How many degrees of freedom does a pooled RSD have?
The total is the sum of (n − 1) across the groups. Three runs of 5, 4 and 6 values give 4 + 3 + 5 = 12 degrees of freedom. Report this number with the pooled RSD because it shows how reliable the estimate is.